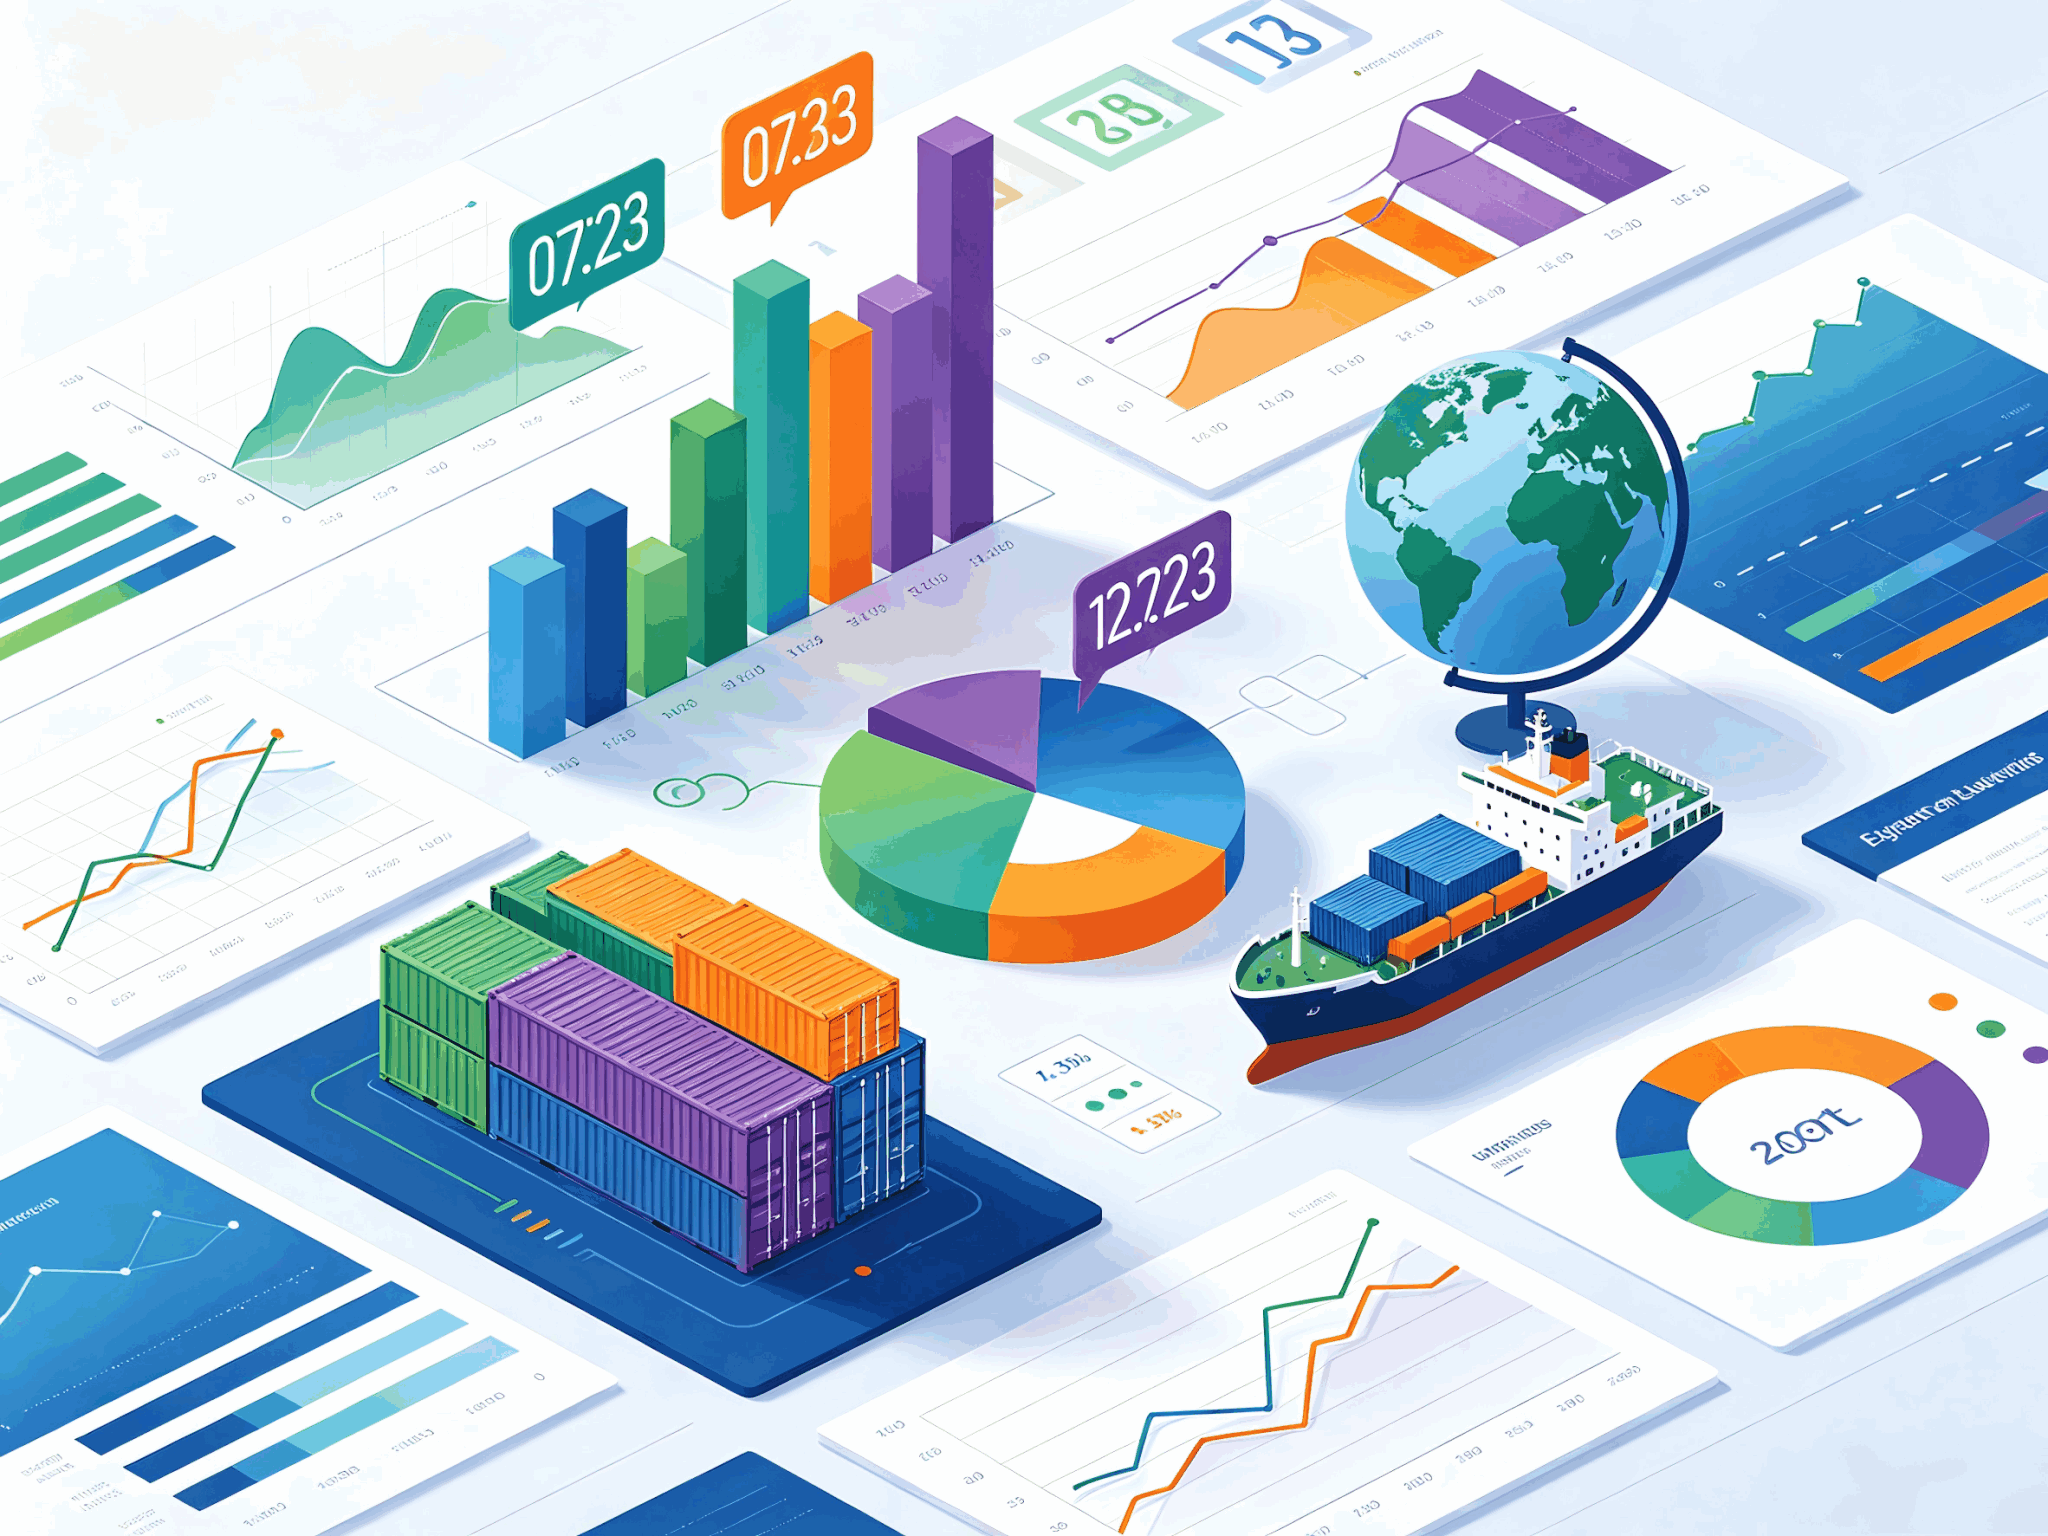
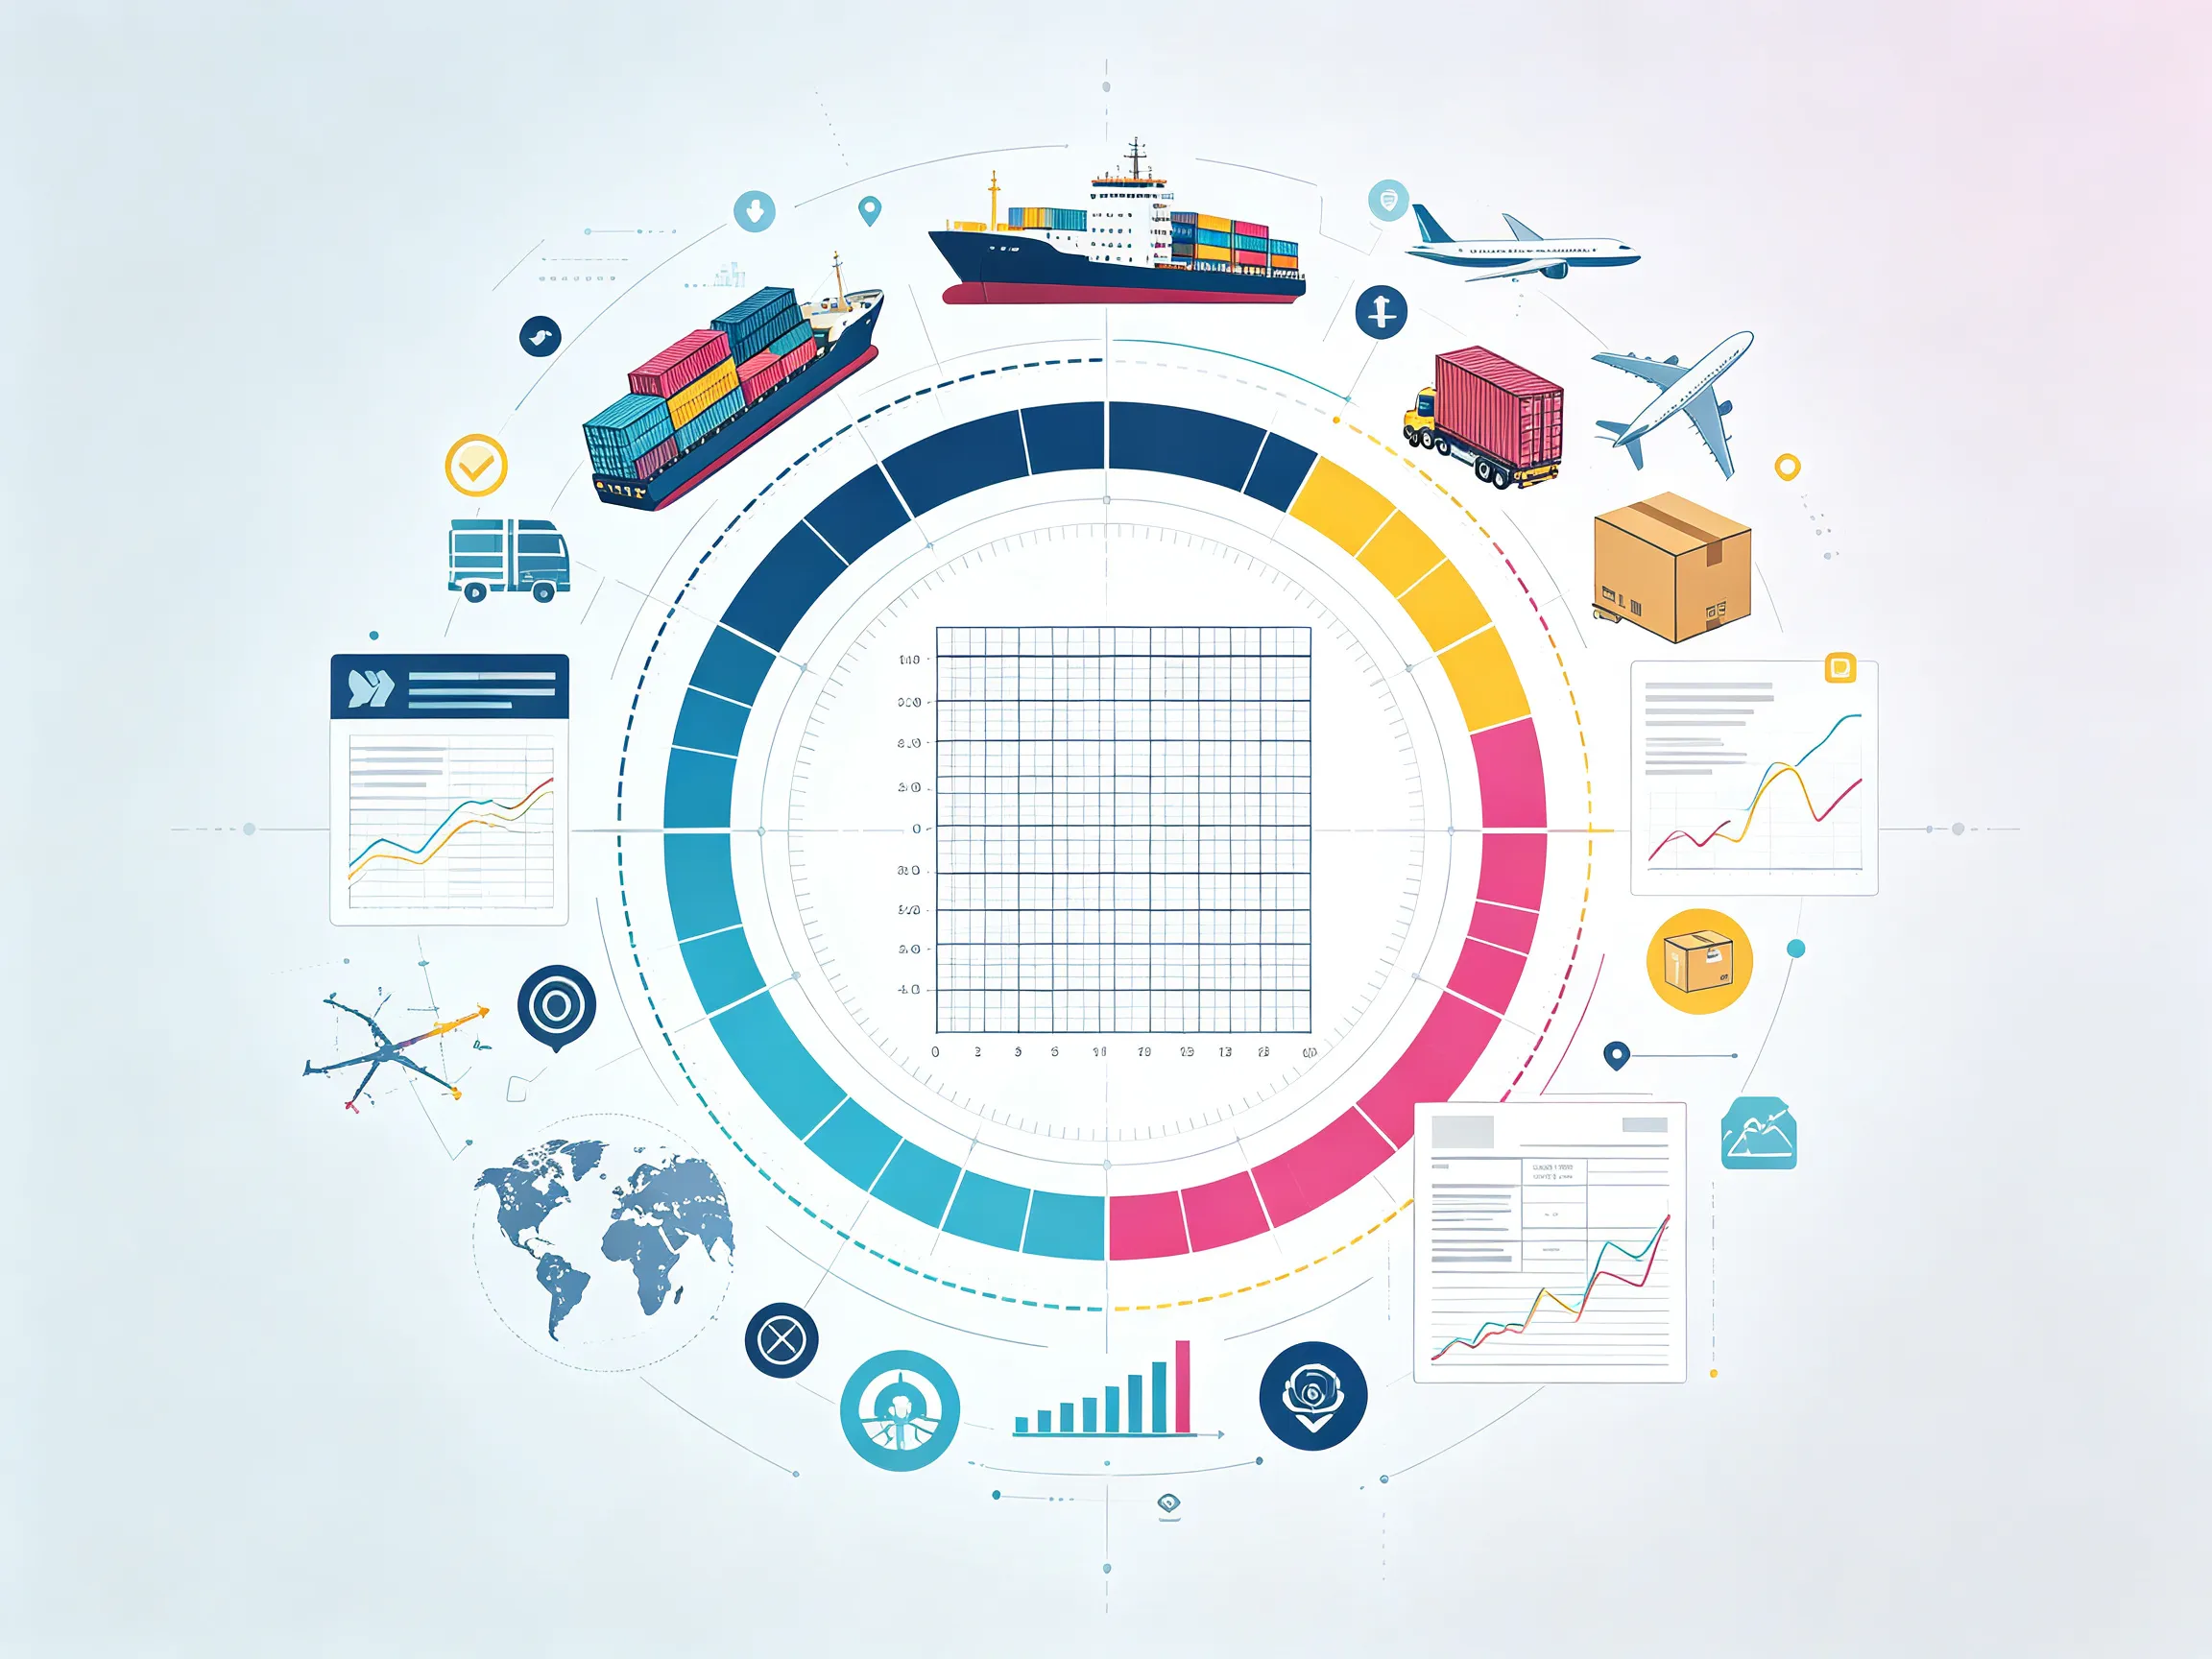
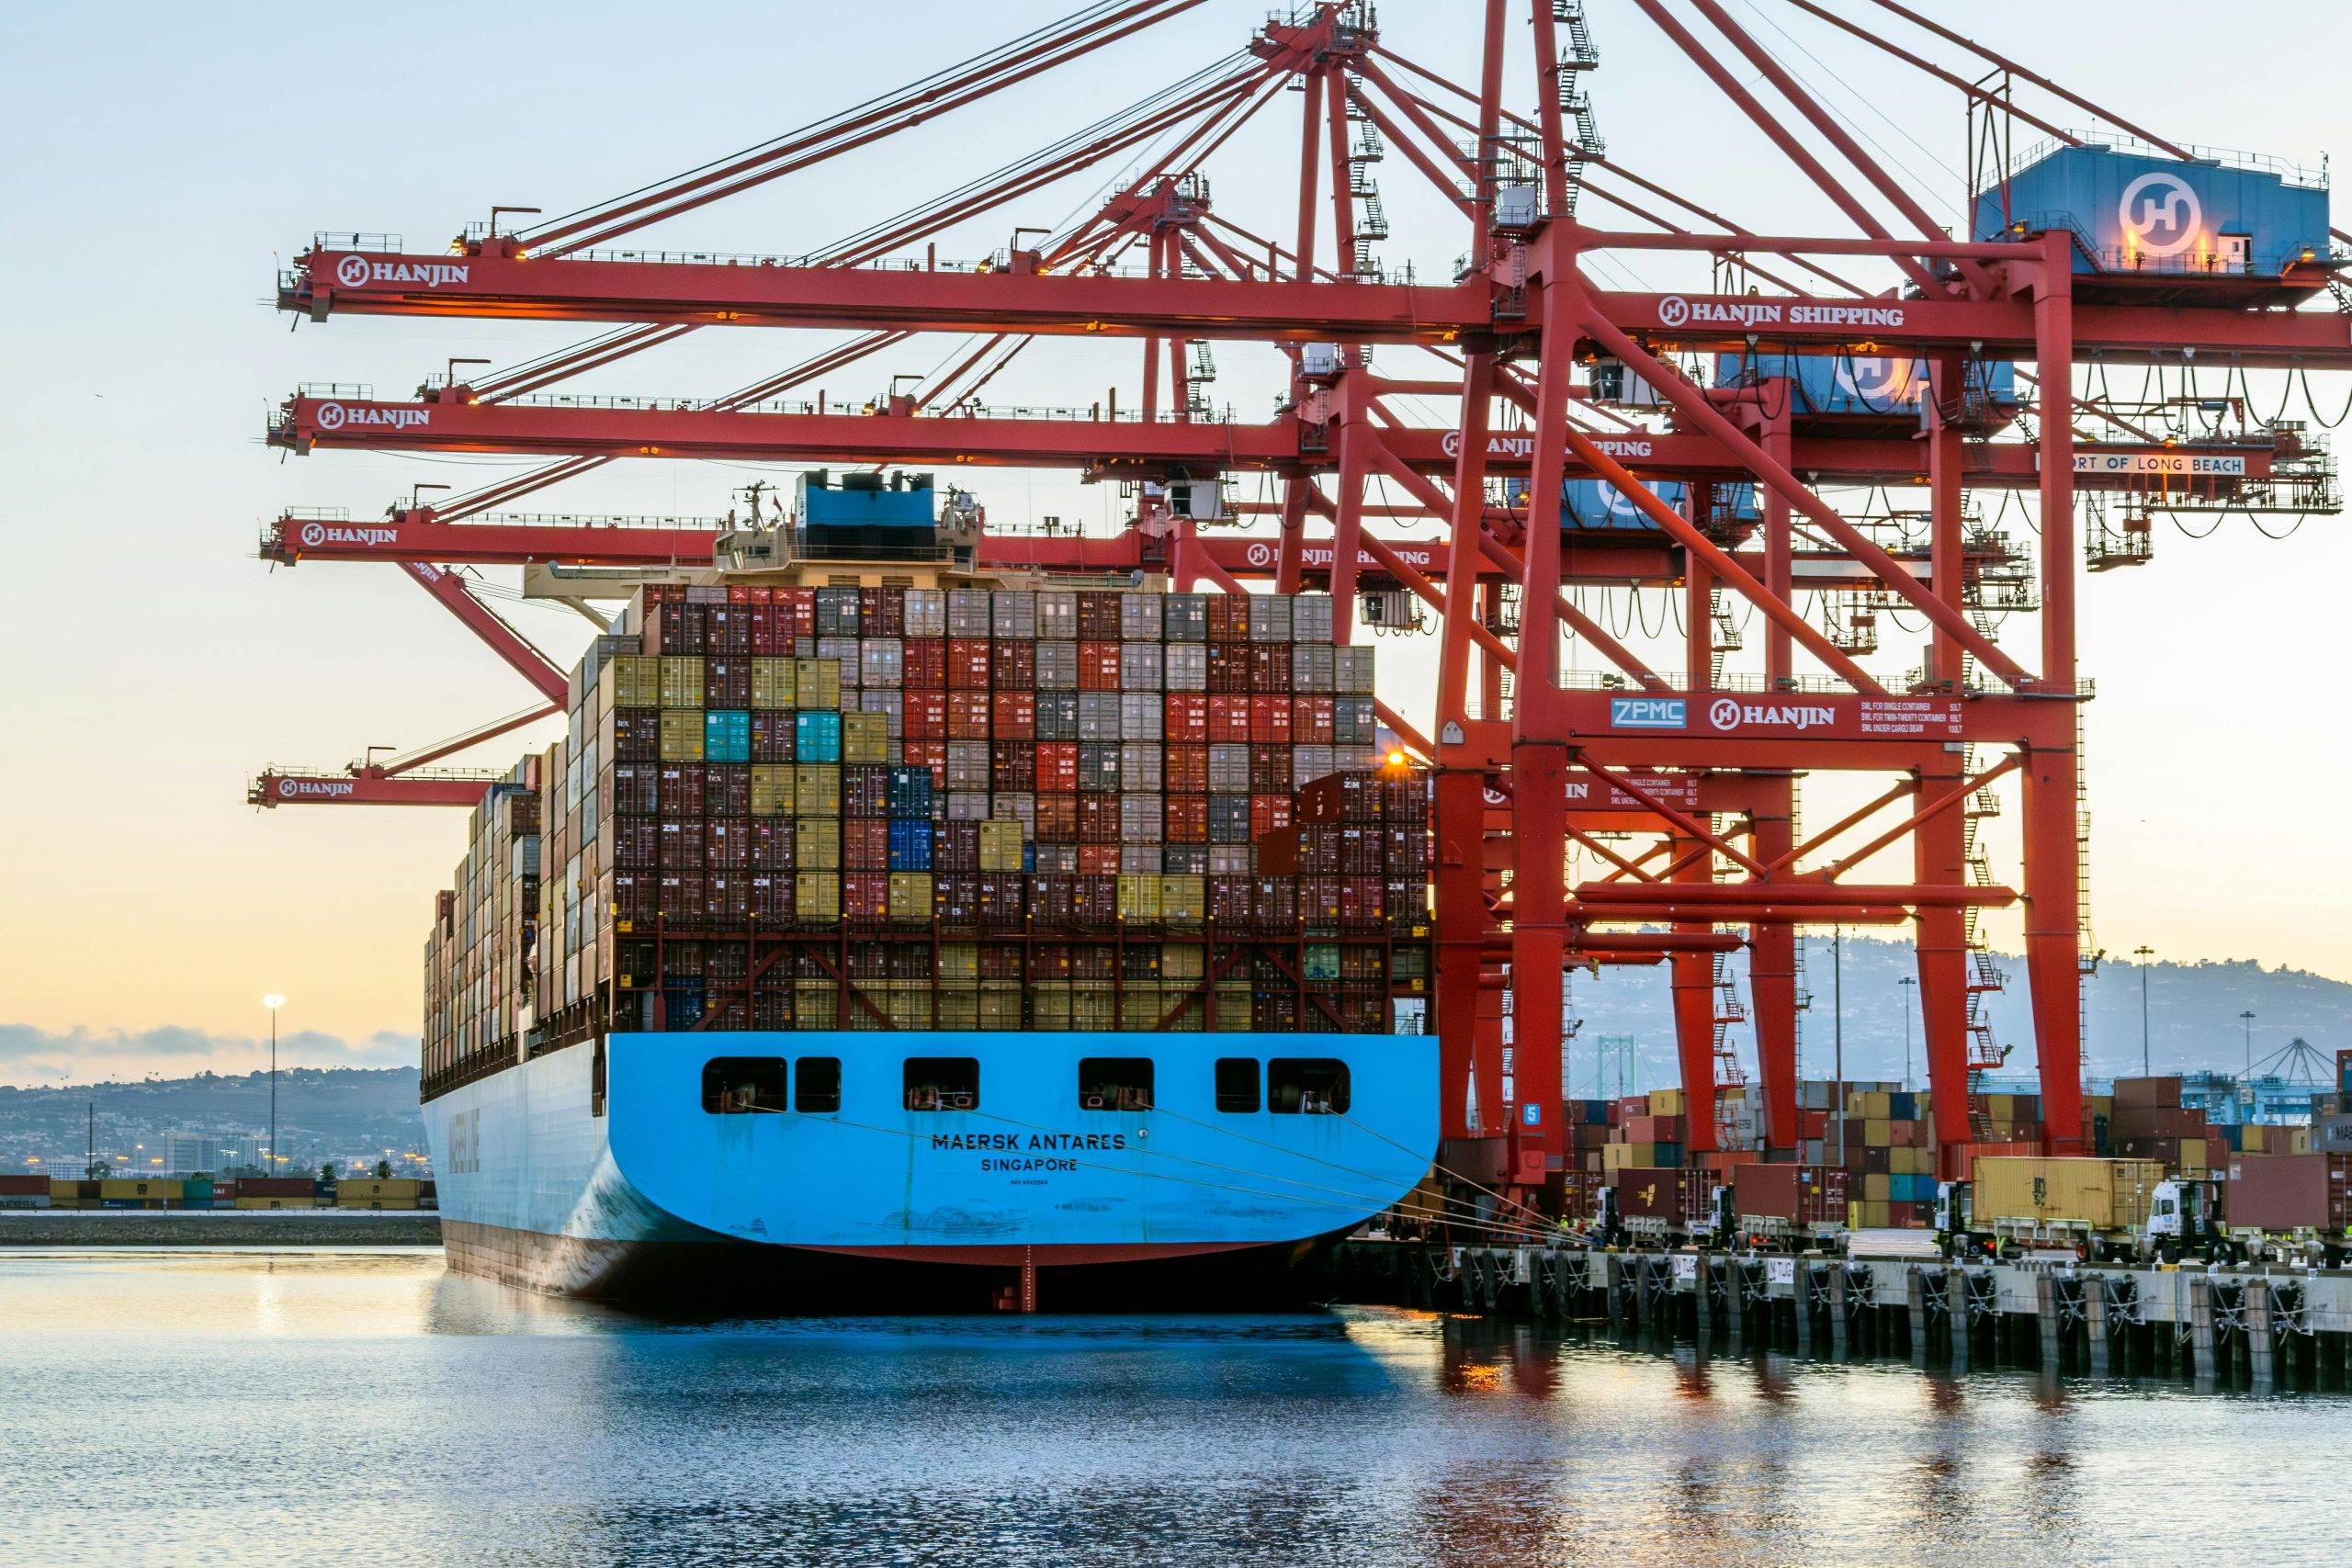
Cross-border trade analytics has become a core decision-making tool for B2B exporters, importers, and supply chain teams. Companies leverage customs filings, bill of lading records, shipping manifests, buyer-seller transaction logs and market intelligence to identify buyers, audit competitors, optimize sourcing routes and mitigate trade risks. However, poor data quality consistently undermines these efforts. Even advanced analytics models will deliver misleading insights if fed with incomplete, inconsistent, outdated or duplicated trade data. Resolving these data quality pain points is critical to turning raw global trade records into reliable, actionable business intelligence.
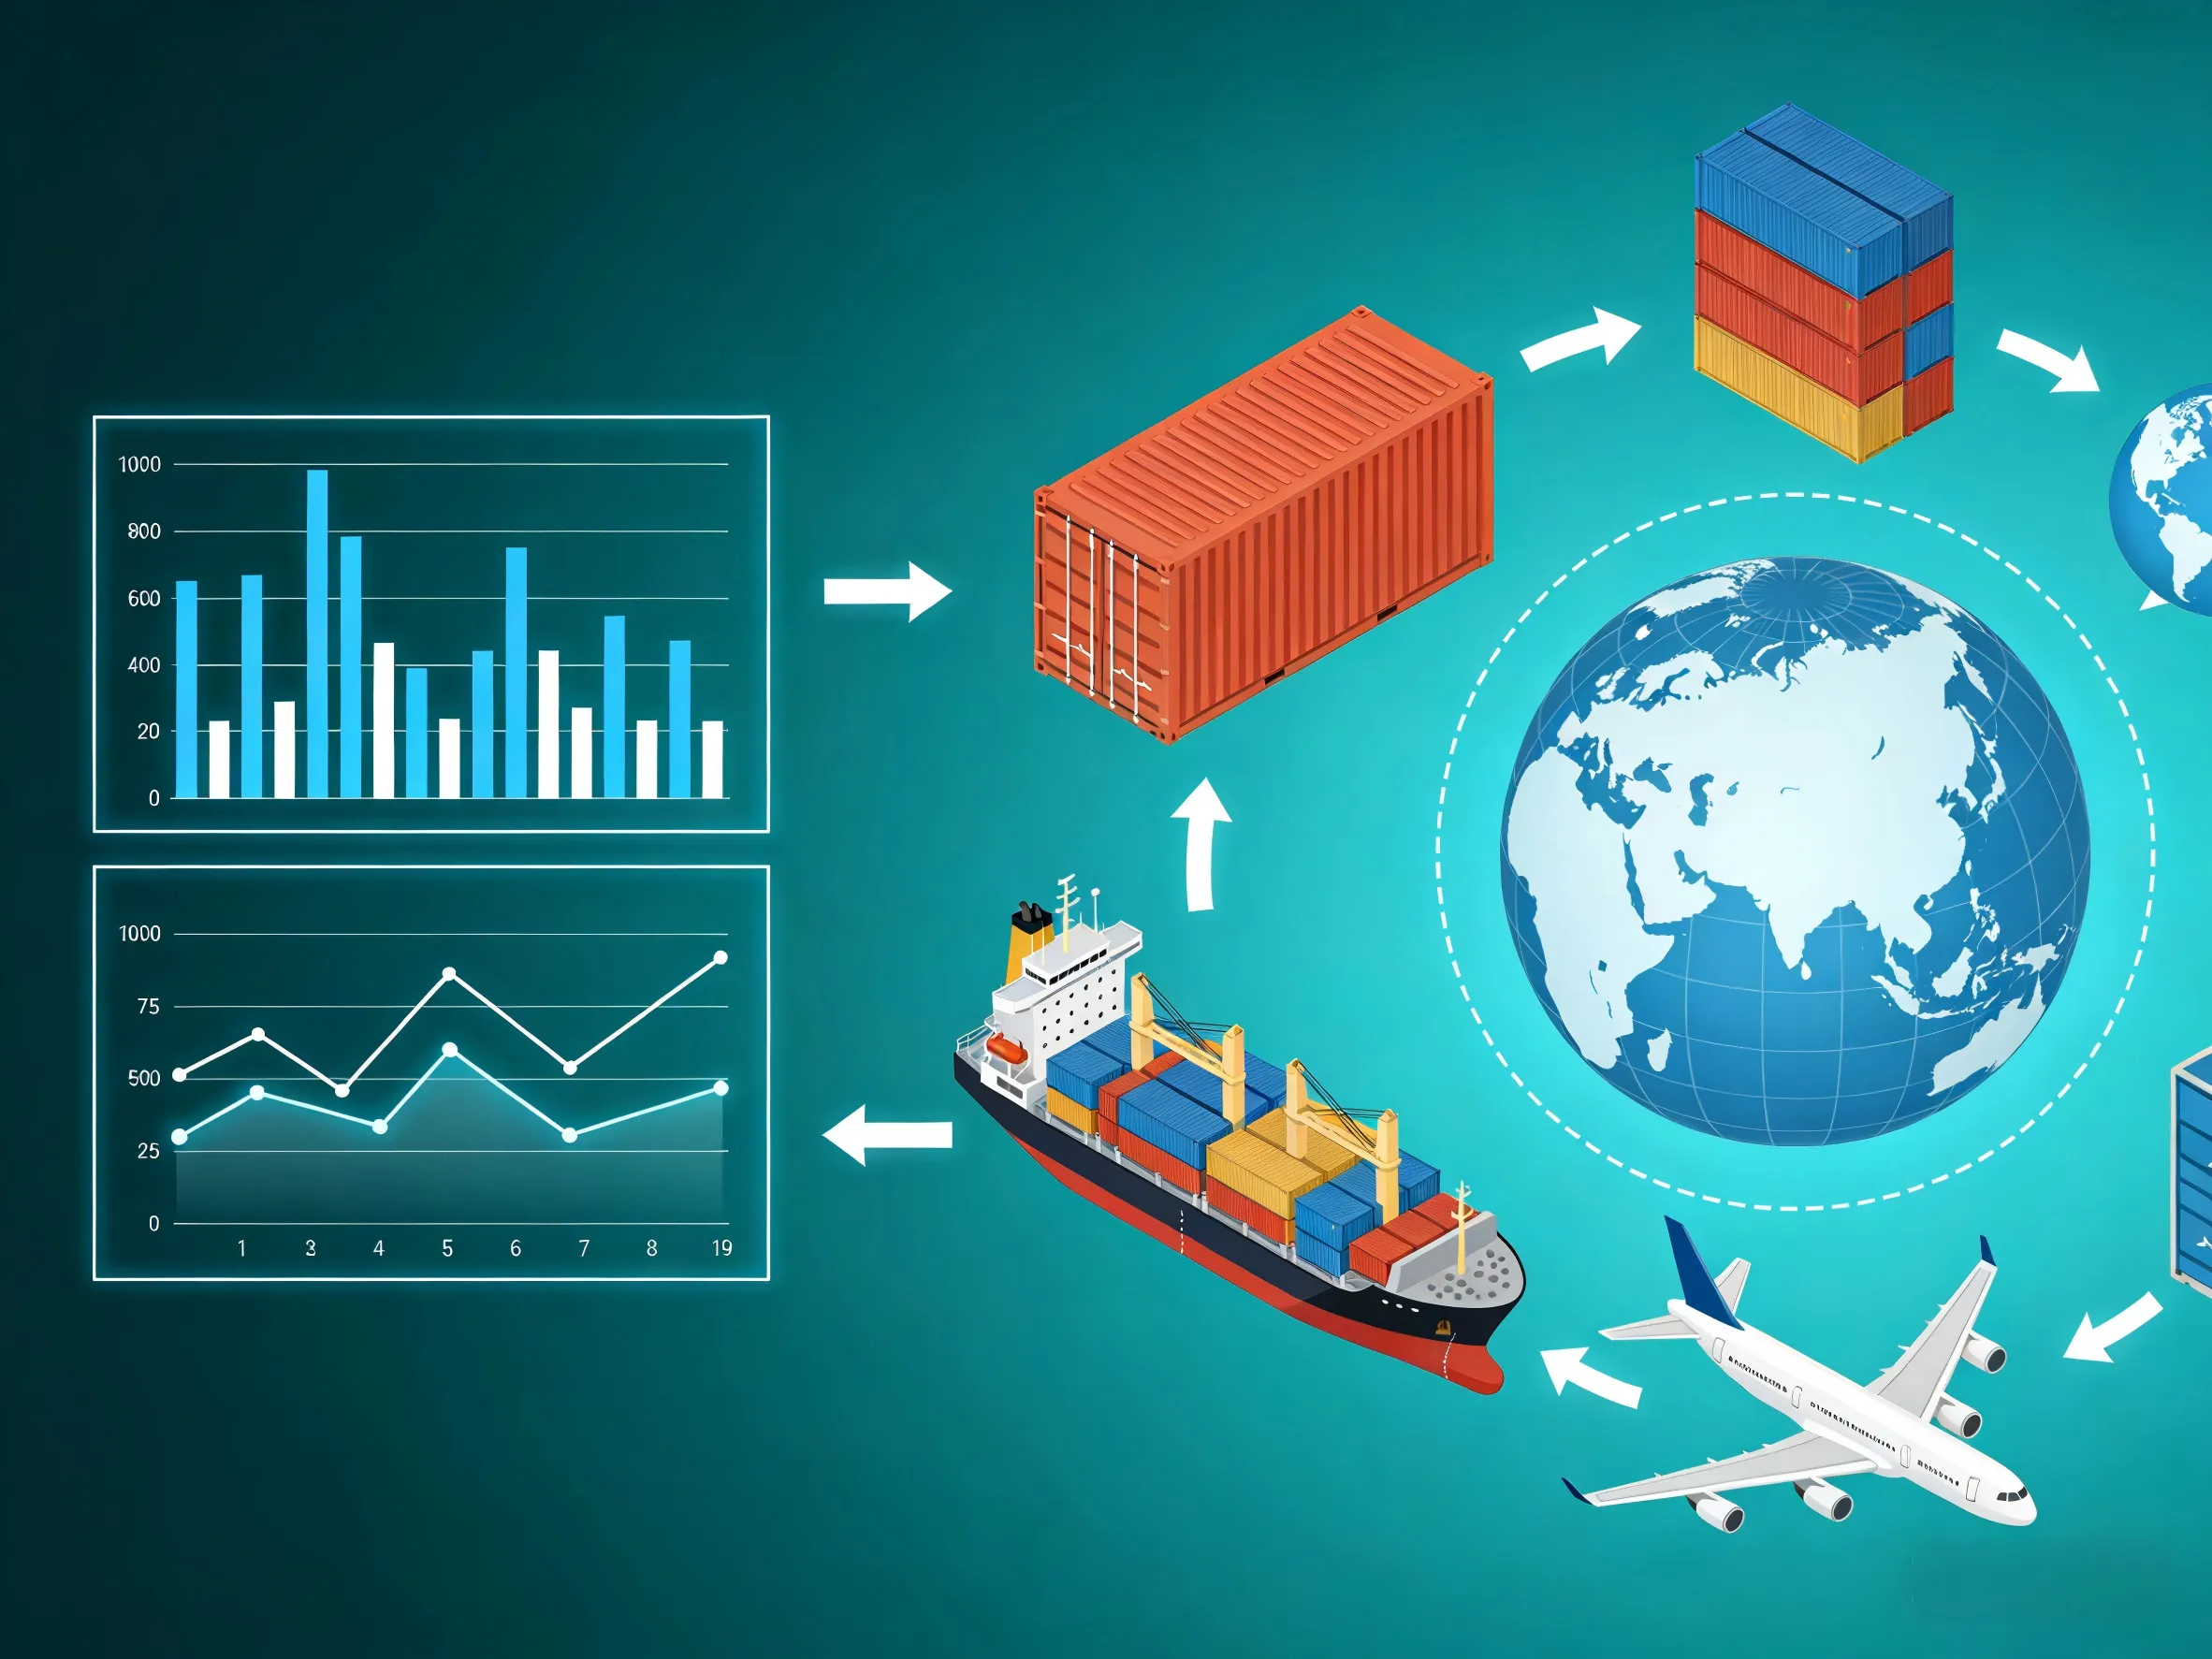
Common Data Quality Issues in Cross-Border Trade Datasets
1. Incomplete and Missing Fields
Trade data originates from dozens of national customs authorities, freight forwarders and shipping carriers. Each jurisdiction follows its own reporting standards. Some countries only require limited information on import declarations, omitting buyer contact details, product HS codes, exact shipment volumes or unit pricing. Bill of lading records may lack the ultimate consignee and only list freight agents, leaving exporters unable to reach real end buyers. Missing key fields make it impossible to segment markets, calculate accurate import volumes or validate genuine demand.
2. Inconsistent Naming and Entity Matching
This is one of the most widespread challenges. Company names appear in multiple variants: abbreviations, translated names, misspellings, legal entity aliases and branch office labels. A single overseas buyer may show up as “ABC Trading Ltd”, “ABC Trade”, “ABC Trading Co” across different shipment records. Without entity resolution algorithms, analytics tools treat these entries as separate companies, inflating buyer counts and distorting market share analysis. Address formatting also varies wildly between countries, further complicating record consolidation.
3. Outdated and Time-Lagged Data
Customs and bill of lading data is not real-time. Many public and commercial trade intelligence platforms have delays ranging from weeks to months. By the time shipment records become available, supplier relationships may have changed, import trends shifted, or a buyer may have switched manufacturers. Slow data refresh rates weaken use cases like monitoring competitor shipment activity and identifying newly active importers. Static historical datasets also fail to reflect sudden policy changes, tariff adjustments or regional supply chain disruptions.
4. Duplicate Records and Erroneous Entries
Duplication frequently occurs when multiple carriers or customs filings capture the same shipment. Manual data entry also introduces typos in HS codes, weight, port names and country codes. HS classification errors are especially damaging: one product can be tagged under two different tariff codes, which skews product-level import volume forecasting. Without automated deduplication and validation workflows, analysts spend excessive time cleaning data instead of running strategic analysis.
5. Fragmented Data Silos
Trade teams often pull data from disconnected sources: customs intelligence platforms, CRM systems, ERP order logs, LinkedIn prospecting lists and freight reports. These datasets exist in separate silos with no unified identifier. It is hard to match a CRM lead record against customs import history. This fragmentation prevents end-to-end buyer journey analysis and creates conflicting reports between sales and supply chain departments.
Practical Strategies to Improve Trade Data Quality
1. Build Standardized Data Schema and Validation Rules
Establish a unified data standard for core fields: entity ID, HS code, shipment date, port, country, cargo quantity and buyer/seller details. Enforce validation rules at the point of data ingestion. For example, automatically flag invalid HS codes, impossible shipment weight values and mismatched country-port combinations. Standardize naming conventions for ports and countries to eliminate formatting chaos.
2. Deploy Entity Resolution for Company Matching
Use fuzzy matching and entity resolution technology to group variant company names, addresses and tax IDs into single unique business entities. Combine rule-based matching with machine learning models to distinguish between parent companies, subsidiaries and freight forwarders. This step directly fixes overcounting issues and lets teams accurately assess the total import volume of a target buyer.
3. Combine Multi-Source Data and Set Data Freshness SLA
Do not rely solely on a single data source such as bill of lading data. Merge customs records, verified company registration data and periodic market surveys to fill information gaps. Define clear service level agreements (SLAs) for data freshness. Prioritize datasets with shorter refresh cycles for time-sensitive use cases like competitor monitoring, while using historical archives for long-term trend analysis. Mark stale records clearly in your analytics dashboard.
4. Automate Deduplication with Periodic Human Audits
Automated scripts can remove most duplicate shipment entries, but schedule periodic manual sampling checks. Human reviewers spot edge cases that algorithms miss, such as shipments with similar values but different consignees. Create a feedback loop where analysts log recurring errors, so validation rules can be continuously updated.
5. Break Down Silos with a Centralized Data Repository
Integrate cleaned trade intelligence data into a central data warehouse or CDP, connected to your CRM. Add a shared unique entity ID linking trade shipment history to sales activities. This allows teams to answer powerful questions: Which high-volume importers have not responded to outreach? Which competitors are increasing shipments to a target market?
Business Benefits of High-Quality Cross-Border Trade Analytics
When data quality is controlled, trade analytics delivers tangible commercial gains. Sales teams can prioritize high-potential buyers with verified import volumes, reducing wasted outreach. Supply chain teams spot emerging market trends and early signs of competitor expansion. Risk teams identify buyers with volatile shipment patterns to mitigate non-payment risks. Reliable trade data also supports better pricing strategy and market entry decisions, reducing costly guesswork in global B2B trade.
FAQ
Q: Is bill of lading data enough for complete cross-border trade analytics? A: No. Bill of lading data focuses on shipping movements and often hides the real end buyer. Pair it with customs declarations and company registration data for a full picture.
Q: How much manual data cleaning is still required after automation? A: Automation handles the bulk of deduplication and formatting. Manual work is mainly reserved for ambiguous entity matches and anomaly validation, which typically accounts for less than 10–15% of the dataset for mature workflows.
Q: What is the biggest bottleneck for trade data quality? A: Inconsistent entity identification. Variations in company names and consignee information remain the hardest challenge across global trade datasets.