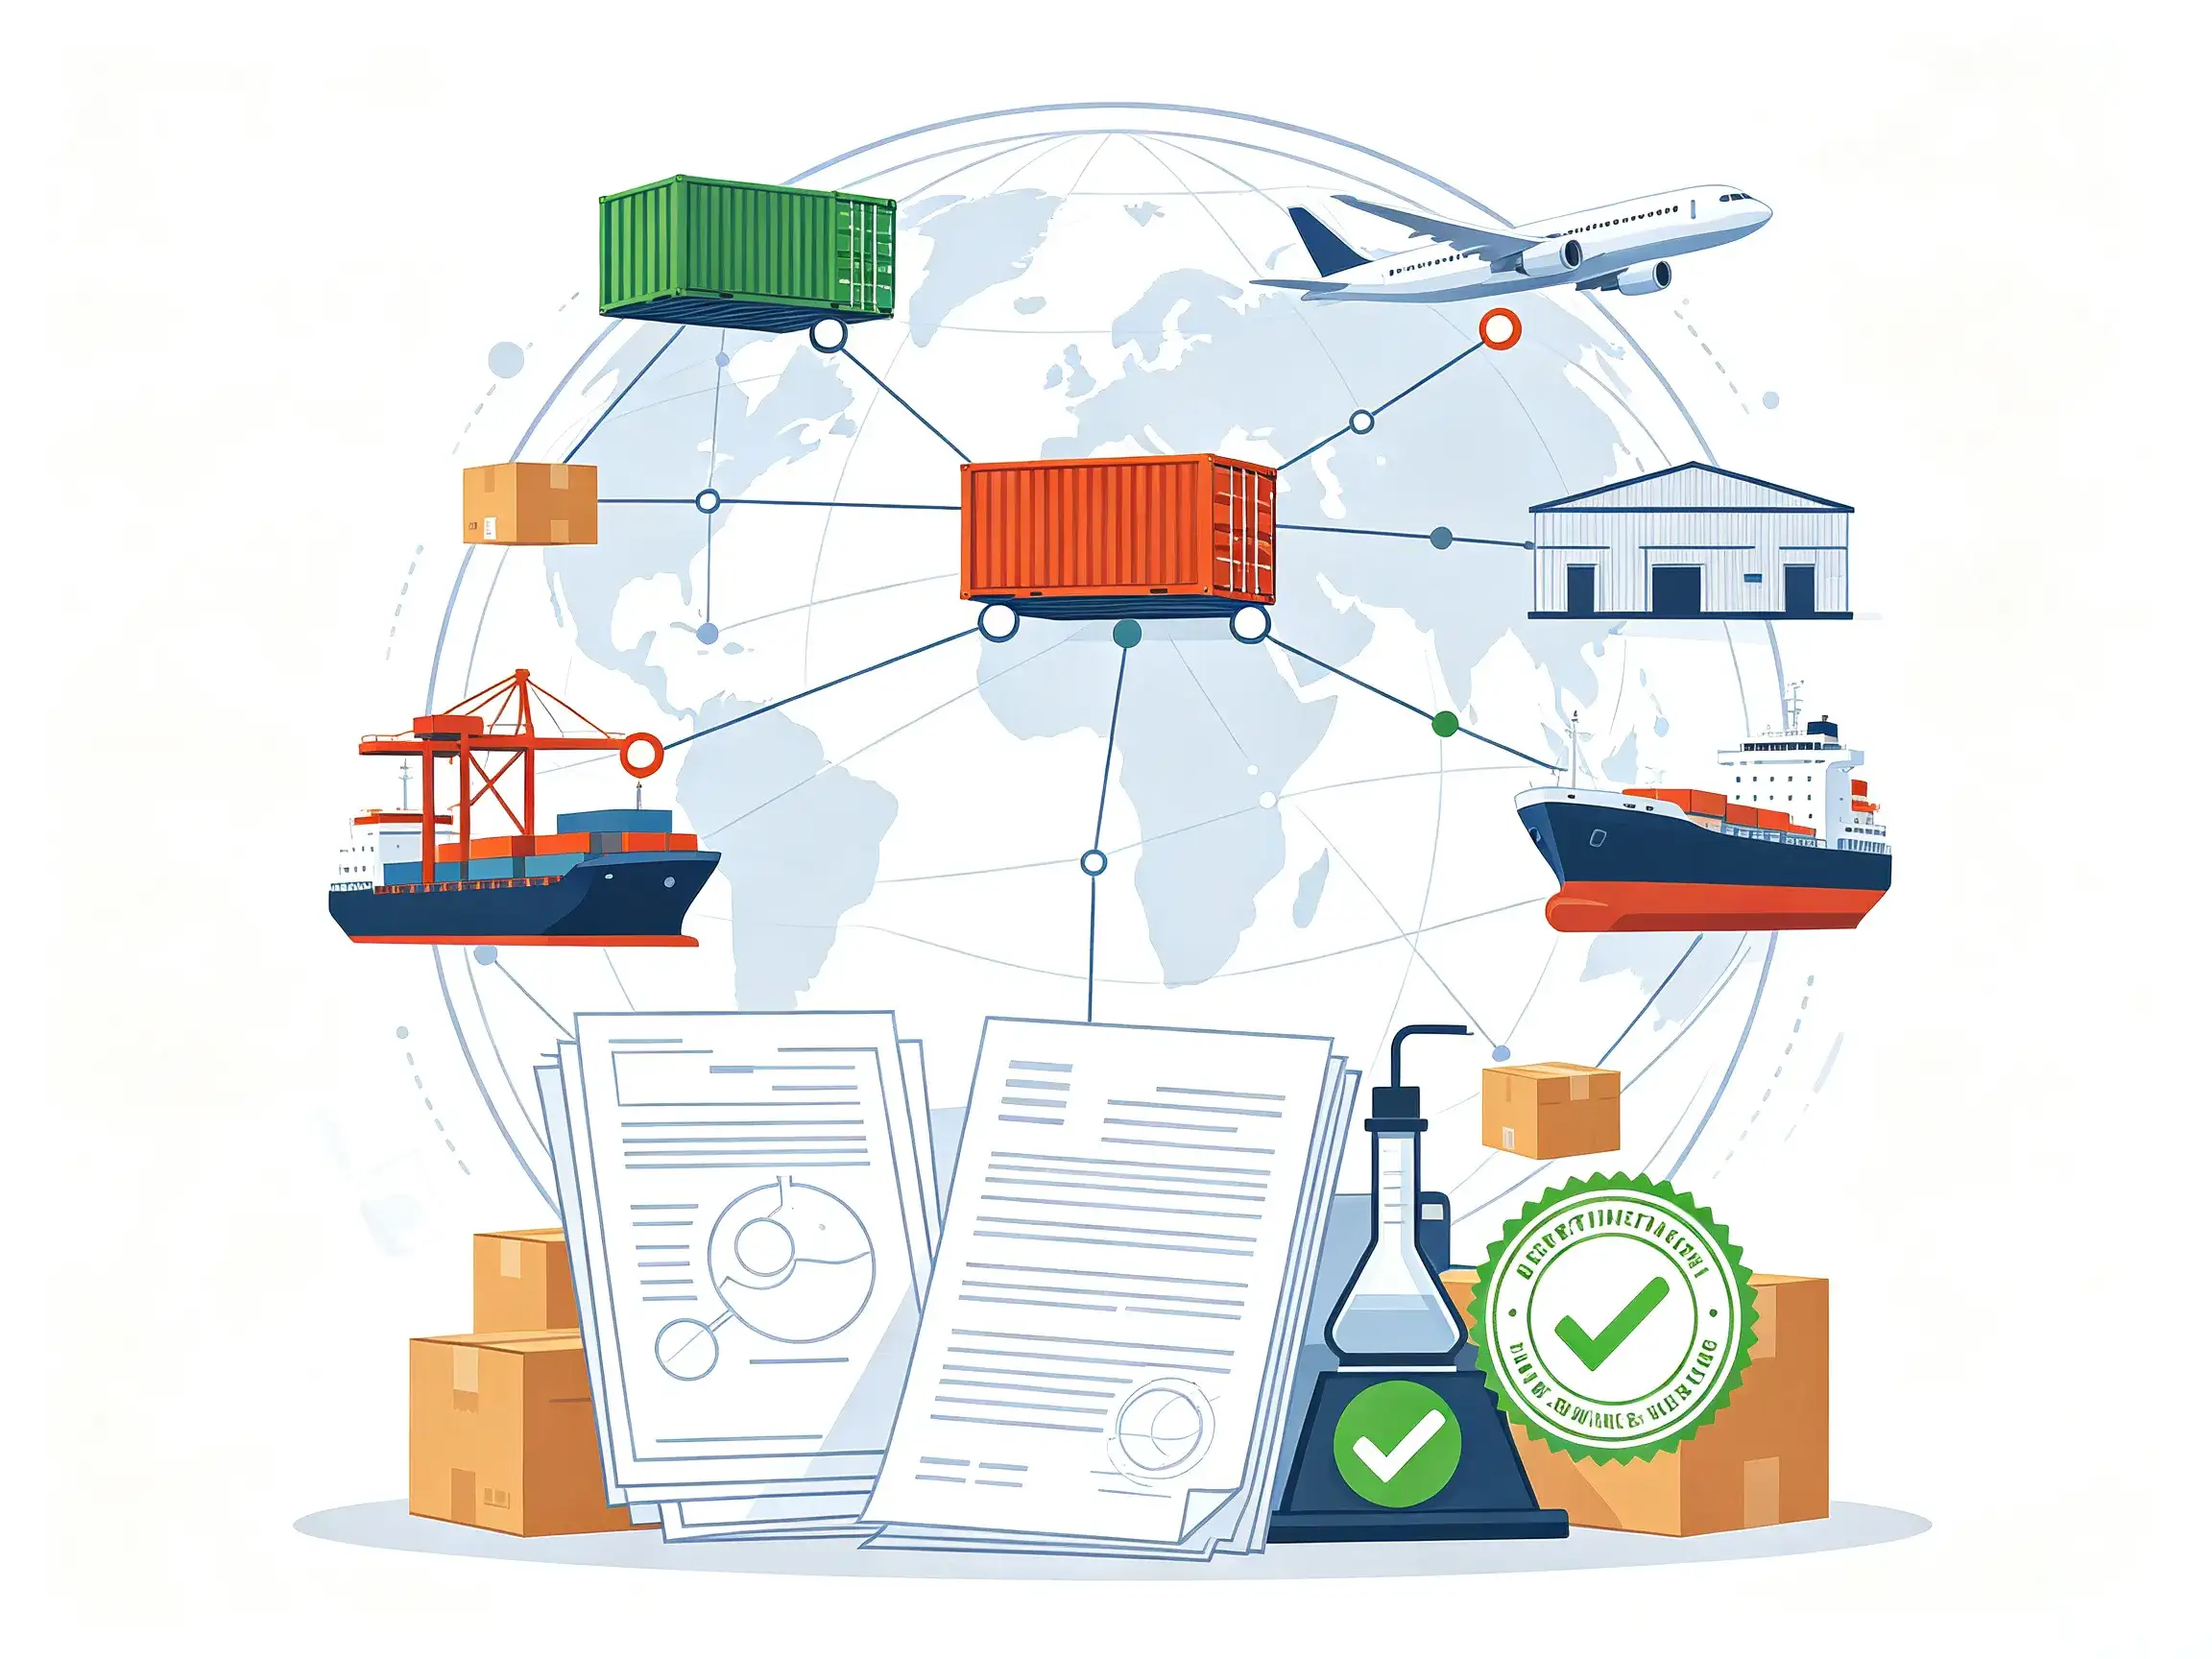
Customs records are one of the most transparent windows into a competitor’s overseas business. Unlike press releases or annual reports, shipment records show who a company actually exports to, how often, through which ports, and in what product categories. In 2026, exporters, importers, and sales teams can use these records to benchmark rivals, find untapped buyers, and identify gaps in their own go-to-market strategy. This guide explains a practical, defensible workflow for reading customs data, avoiding common analytical traps, and turning shipment records into commercial decisions.

What Customs Records Show — and What They Do Not
Customs data generally comes in two forms. Shipment-level records, often built from bills of lading, list fields such as shipper, consignee, product description, quantity, weight, loading and discharge ports, and shipment date. Aggregate trade statistics, published by national customs offices and statistical agencies, report flows by country, HS code, and trade value at a summary level, without company names.newtheorum.comBill of Lading Data
Coverage differs sharply by country. In the United States, ocean manifests are public, so shipper and consignee names on sea freight can be identified through customs records. The European Union, by contrast, applies a confidential customs-declaration regime, so company-level shipment detail is generally not published; analysts rely on aggregate EU statistics and mirror data sourced from partner countries. Many other markets fall between these poles, so check what fields exist in each record family before drawing conclusions.LandedFees
It is equally important to know the limits. A bill of lading may not show the actual transaction value; dutiable value is often filed separately in the importer’s entry summary. Recorded descriptions can be generic, consolidation can mix multiple suppliers’ goods on one manifest, and the consignee may be a freight forwarder or trading house rather than the end customer. Treating customs data as evidence of shipment activity rather than a perfect financial ledger prevents overconfident conclusions.yTrade
Step 1: Identify the Competitor and Its Legal Entities
Start the analysis by pinning down the exact legal entity the competitor uses for export. Companies often ship under a parent name, a subsidiary, a factory entity, a brand, or a trading arm, and these names may appear with spelling variants, abbreviations, or local-language forms. Search the brand, registered company name, known factory address, and associated website domains, then consolidate the variants into one watch list.
Next, map the product scope. List the HS codes and product descriptions most relevant to the competitor’s catalog so you can separate relevant exports from unrelated goods shipped by the same entity. This entity-and-code foundation keeps later results focused and reduces false matches caused by common company names.
Step 2: Pull Shipment Records and Verify Coverage
Run the entity and HS-code queries across the available customs database, then check the coverage notes for each destination country. Confirm the date range, freight mode (ocean, air, or land), and whether records reflect exports out of the competitor’s home country or imports into target markets. Mirror records from partner countries can fill gaps where the origin country does not publish company-level detail.
Review raw records for duplicates and naming variants before aggregating. Normalize country names, ports, units, and descriptions into consistent fields while keeping original text for verification. Clean records make later volume or customer analysis trustworthy.
Step 3: Build the Competitor’s Customer and Channel Map
With clean records, identify the recurring consignees tied to the competitor’s shipments. Frequent buyers with repeated shipments across several months indicate established accounts; single-transaction consignees may be one-off orders, distributors, or freight intermediaries. Classify each consignee by its likely role — direct buyer, wholesaler, distributor, or forwarder — using company name, website, and sector signals.
Layer in destination countries and ports to see where the competitor concentrates its overseas business. Compare high-volume trade lanes with emerging ones: mature lanes suggest entrenched relationships, while new ports or destinations can signal expansion into markets your team may want to monitor.
Step 4: Analyze Product Mix, Volumes, and Pricing Signals
Examine how shipments break down by HS code and product description over time. Shifts in product mix reveal where the competitor is pushing premium lines, commodity products, or new SKUs. Quantity, weight, and shipment frequency show shipment scale and cadence: regular, frequent consignments often indicate steady replenishment contracts, while irregular large shipments may reflect project or seasonal orders.
Pricing must be handled carefully. Where records include a declared or customs value, you can derive rough per-unit or per-kilogram proxies and compare them across shipments and rivals. Where value is absent, use quantity, weight, and frequency only as activity indicators, and avoid inferring margins or exact prices. Cross-check large unit-value swings against possible product mix changes or consolidation effects.
Step 5: Spot Geographic Expansion and Seasonality
Aggregate monthly shipment activity to reveal seasonality and growth trends. A steady rise in shipment count, weight, or number of consignees into a specific region can signal active market development; sudden losses of recurring buyers may indicate account turnover worth probing. Compare these signals with official aggregate trade statistics for the same HS code and destination to determine whether the competitor’s movement reflects its own gain or a broader market trend.
Mirror analysis strengthens this check: compare the competitor’s reported exports against imports recorded by destination countries to spot discrepancies in quantity, weight, or value that may reflect misclassification, routing through intermediaries, or data gaps in one source.World Customs Organization
Step 6: Convert Findings Into Actionable Strategy
Translate the record analysis into concrete commercial actions. The competitor’s established consignees may be accounts to benchmark against; new or underserved destinations represent potential expansion targets; product categories that grow steadily show where demand is strengthening. For sales teams, forwarders and distributors appearing on many manifests can be mapped as channel partners to approach directly.
Re-monitor the watch list on a fixed cadence instead of running a one-off analysis. Re-run entity, consignee, and HS-code queries, and update the customer map as new shipments appear. This keeps the picture current and catches competitive moves early.
Limitations and Compliance Notes
Keep the analysis grounded in what the records legally permit. Customs data reflects declared shipment information, not internal margins, contracts, or customer satisfaction. Values may be affected by transfer pricing, consolidation, and classification choices, and some consignees hide behind trading intermediaries. Always use the data for legitimate market research, respect applicable privacy and data-protection rules, and do not republish private business information beyond what the source record permits.
Frequently Asked Questions
Can I see a competitor’s exact export revenue from customs records?
Not reliably. Shipment-level records rarely expose true sales revenue, and customs values are often filed separately from commercial invoices. Records are better for identifying customers, product mix, routes, and shipment frequency than for reading profit and revenue.
Why do some countries show company-level data and others only aggregates?
National rules differ. Some countries publish ocean manifests publicly with shipper and consignee names, while others keep customs declarations confidential for commercial privacy. In closed-regime markets, analysts rely on aggregate statistics and mirror records from partner countries.
How often should customs records be checked for competitor analysis?
A monthly refresh is usually sufficient for monitoring existing rivals, while quarterly reviews suit broader market scanning. Focus the cadence on competitors in active expansion lanes, where shipment changes appear most quickly.
What is mirror analysis in trade data?
Mirror analysis compares exports reported by one country against imports reported by its trading partner for the same goods. Differences in quantity, weight, or value can reveal data gaps, classification issues, or routing through intermediaries, and it is commonly used to verify shipment flow completeness.